Bitcoin CAGR Data & Charts
This page shows Bitcoin's CAGR displayed in table and chart format.
Want to know what CAGR means? Click here to learn more.
| Year | CAGR (%) |
|---|
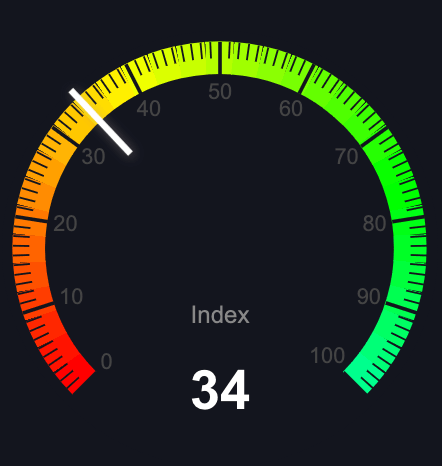
Bitcoin CAGR Chart
If you prefer to view Bitcoin's CAGR as a chart, try the chart below.
What is CAGR?
CAGR, or Compound Annual Growth Rate, is usually used to determine the average growth rate of an asset per year.
It's the rate at which an investment grows annually, assuming that the investment has been compounding (going up) over the period.
1-Year CAGR Example
- Initial Value (Beginning of Year 1):$10,000
- Final Value (End of Year 1): $15,000
In the simple example above, since Bitcoin went up 50% in one year, its one year CAGR would be 50%.
The math gets more complicated when calculating CAGR for more than 1 year.
3-Year CAGR Example
- Initial Value (Beginning of Year 1):$10,000
- Final Value (End of Year 3): $21,600
The CAGR here would be 27.3%.
Why?
If you do $10,000 x 1.273 three times you will get close to $21,600.